What Spider 2.0 reveals about AI-generated SQL, business definitions and enterprise workflows—and how to evaluate answers before trusting them.
Your team asks an AI assistant which customer group has the strongest retention. It finds the data, writes a query and returns a convincing chart. The query runs without an error. The group at the top is also your largest.
That might be the right answer. Or the assistant might have ranked groups by their number of users instead of their retention rate. The database can execute both calculations. It cannot decide which one you intended.
Spider 2.0 examines the work hidden inside that gap between a business question and a correct result. The research goes beyond asking whether a model can write SQL. It asks whether an agent can navigate an unfamiliar data environment, apply its documentation, carry out a sequence of operations and finish the task.
For technical and product leaders, the distinction changes how to evaluate an analytics assistant. A strong demonstration should show how the system established the meaning of the answer, not only how quickly it produced one.
The authors argue that conventional text-to-SQL tests simplify too much of the work that enterprise analytics requires. A model may receive a question and a prepared description of a database, then generate one query. In a working environment, someone must first find the relevant data, understand its structure, locate business definitions and determine which operations the question requires.
Spider 2.0 introduces a benchmark of 632 tasks designed around more of that work. Its agent setting supplies a database interface and project context, which can include code and documentation. The system can inspect the environment, execute queries, change code and use the results to decide what to do next. The requested output may be a table, an answer or a transformed database.
That contribution matters because it changes where success is measured. Producing a plausible query is an intermediate step. Completing the requested analytical task is the outcome.
The paper’s workflow overview and task comparison make the difference visible. In the self-contained setting, the model receives a question, database structure and supporting documents, then returns SQL. In the agent setting, it can inspect the environment, run SQL or Python, observe what happened and revise its work before returning the final result.
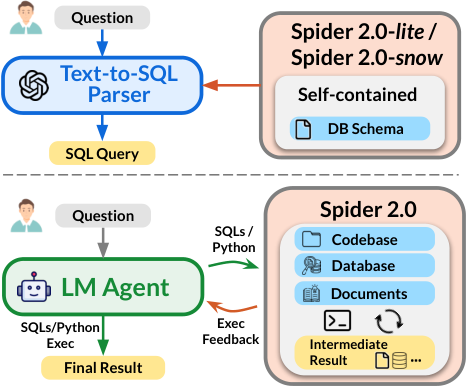
Original Figure 2 — Lei et al., Spider 2.0, v2. Source and caption. Select the image to view it at full size.
Figure 2 isolates the evaluation boundary. The upper path returns a SQL query; the lower path returns a result after interacting with the environment. Although the upper diagram emphasizes the database schema, the paper’s task definition also supplies auxiliary documentation in that setting.
The distinction matters when you assess a vendor demonstration. Supplying the correct schema and relevant documents already resolves part of the discovery problem. Ask what the system was given, what it had to discover, and whether you are judging the generated query or the completed business task. These are different evaluation boundaries, even if both products are described as “AI for SQL.”
Consider three kinds of work the benchmark exposes.
The useful information may be inside a nested record. An event can contain a collection of named parameters rather than a simple column for every value. An assistant needs to understand which parameter contains the session identifier or page address and how to extract it without losing the relationship to the original event.
The meaning of a field may depend on a separate document. A page address does not necessarily explain whether the business considers it a product listing or a product detail page. The correct categorization can depend on rules maintained outside the database schema.
The answer may require work across a project. Some tasks involve updating data transformations rather than returning a single query. The agent has to inspect existing files, understand dependencies, write the right changes and verify the resulting data.
These are different difficulties. More context can make relevant information available without ensuring that the agent applies it correctly. The paper’s analysis of task types includes failures involving nested fields, external documentation and project-level transformations.
The appendix’s original data-type chart shows why the problem is broader than choosing a column name. The benchmark includes text and numbers alongside dates, timestamps, nested records, arrays and other structured values.
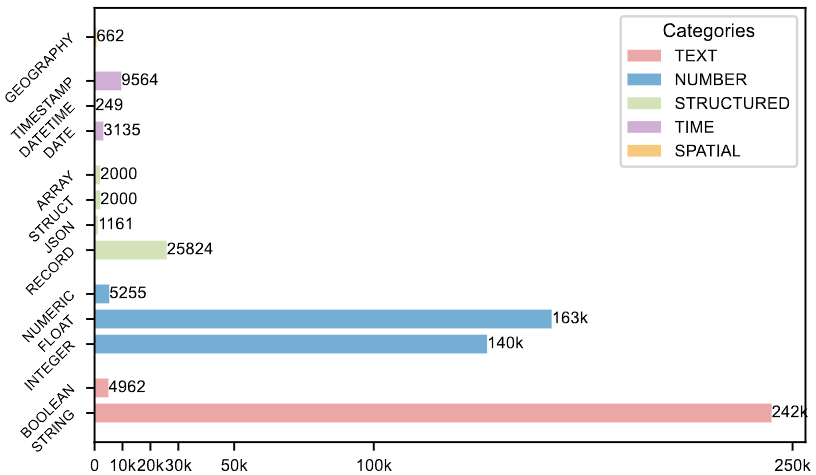
Original Figure 17 — Lei et al., Spider 2.0, v2. Source and appendix explanation. Select the image for full size.
A plain number can often be aggregated directly. A value inside an array or record first has to be located and extracted; a time field may need conversion before it can be compared. Those operations can alter which records reach the calculation. The conversion example below makes this concrete: the session and page address must be extracted from event parameters while retaining their relationship to the visitor.
The chart establishes variety in the benchmark, not how often your assistant will fail on each type. For your evaluation, include the actual shapes your team uses instead of testing only a tidy table of text and numbers.
The paper’s benchmark comparison puts numbers behind the change. For three selected benchmarks, its reported columns per database rise from 27.1 in Spider 1.0 and 54.2 in BIRD to 743.5 in Spider 2.0. Reported SQL length rises too: 18.5, 30.9 and 148.3 tokens per query, respectively. The paper counts whitespace-separated pieces of SQL, giving a rough measure of query length.
Original Table 2 — Lei et al., Spider 2.0, v2. Full table and caption. Scroll horizontally to read all columns. “Tok.” means tokens and “Func.” means functions; the asterisk marks statistics taken from the development set because the test set was unavailable. All rows and columns are retained from the source table.
More columns mean a larger set of fields to navigate before choosing the ones that answer the question. Longer reference queries suggest more work than a short lookup, although length alone cannot tell you whether a query is difficult or well designed. These benchmarks also differ in task construction and available context, so the table does not establish how much any single factor lowers success.
For your evaluation, use questions that resemble your own data environment. A demonstration over a handful of prepared fields does not test discovery across hundreds of columns. Equally, a narrowly scoped assistant with approved definitions may have a much smaller job than the full Spider 2.0 workflow. Compare the work you intend to delegate, rather than treating a benchmark name as a universal difficulty rating.
In the March 2025 version, Spider-Agent using o1-preview completed 21.36% of the Spider 2.0 tasks. The evaluation checks the required result; success is not simply whether the SQL executes. Depending on the task, that result can be a returned table or a changed database.
The result is evidence that those workflows challenged the evaluated system. It is not an estimate that your assistant will answer one question in five correctly. Your data, task boundaries, preparation and model configuration may be different, and the paper reports a historical experiment.
The paper’s conversion task and reference plan asks for the conversion rate from product listing pages to product detail pages in Google Analytics data on January 2, 2021. A listing page presents a collection of products; a detail page presents one product. The business question is how often browsing a collection leads into viewing an individual item.
That sounds like a request for one percentage. But the reference plan must reconstruct page views, classify the pages and establish which movement between them counts before calculating a rate. This is a worked reference plan in the benchmark, not a reported successful agent run.
The plan selects the day’s page-view events and extracts values from nested event parameters. These include ga_session_id, which identifies a session, and page_location, which supplies the page address. The analysis needs to retain each event’s relationship to its user and session so it can reconstruct that visitor’s path.
In practical terms, the assistant is turning a bundle of event attributes into something an analyst can inspect: who visited, in which session, and which page they viewed. Those records are the input to the conversion calculation.
For a reader evaluating an assistant, the point is to inspect the intermediate representation. Does each row still correspond to the intended event? Is it associated with the correct user and session? If the extraction loses that relationship, a later calculation can be perfectly consistent with the wrong input.
This is why asking only to see the final SQL is often insufficient. An intermediate table of events, session identifiers and page addresses gives an analyst a smaller and more understandable object to verify.
The reference plan categorizes page addresses as listing or detail pages using URL structure and keywords. The model must turn those definitions into a rule that works on the actual records.
The distinction is consequential. A mistaken category can move an event into the wrong part of the conversion calculation even when the query itself is valid. The paper’s separate failure analysis describes an agent reading page-category documentation yet failing to translate its rules correctly into SQL. Reading the document was an action the agent completed; applying it correctly was a different requirement.
For your own evaluation, include a few page addresses with agreed categories and require the assistant's classification to match them. That makes the business definition testable before it is buried inside the final aggregation.
The source plan orders pages within a user's session and identifies cases where a listing page is followed by a detail page. Sequence is part of the metric, not merely a way to arrange the output.
Consider two illustrative visits: listing → detail, and listing → search → detail.
Both visitors eventually reach a detail page, but only the first makes an immediate listing-to-detail transition. Counting eventual arrival and counting the next-page transition answer different questions. An assistant that silently substitutes one for the other can produce a reasonable-looking answer that does not match the team's decision.
The reference calculation also uses listing-page views as its denominator. A team asking for the share of distinct sessions that convert must define that calculation separately. Repeated listing views can affect a view-based measure differently from a measure that counts each session once. The label “conversion rate” does not settle the choice.
The lesson is to make the unit, sequence and denominator explicit before accepting the percentage. Otherwise, a disagreement about the result can actually be a disagreement about what was measured.
The paper provides both the starting SQL and its rewritten version in Table 15. This is how the researchers made the benchmark task more demanding, rather than an example of an agent debugging a query. Read the final calculation in the first image and the added stages at the bottom of the second; those are the parts that change the question being answered.
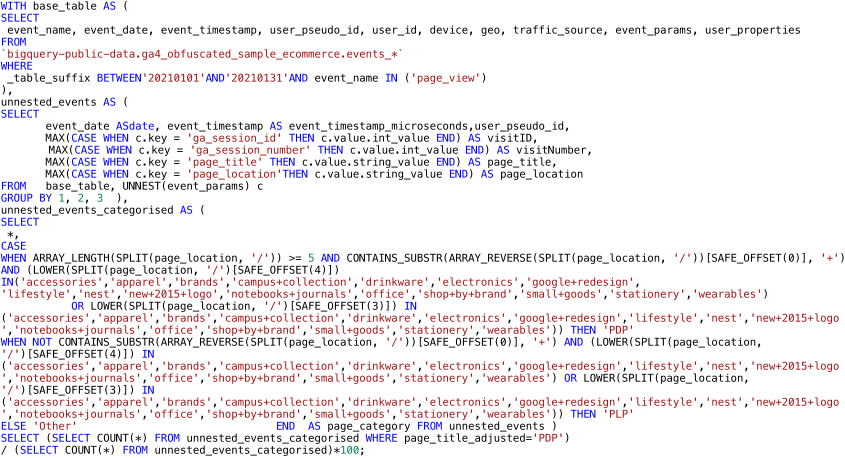
Original SQL panel, Table 15 — Lei et al., Spider 2.0, v2. Source. Select to inspect the full-size code.
The starting calculation counts a category. Its final expression is intended to count detail-page rows, divide by the page-view rows and multiply by 100. That describes the share of views on a detail page. It does not establish that a visitor came from a listing page: a visitor could arrive through search or a direct link.
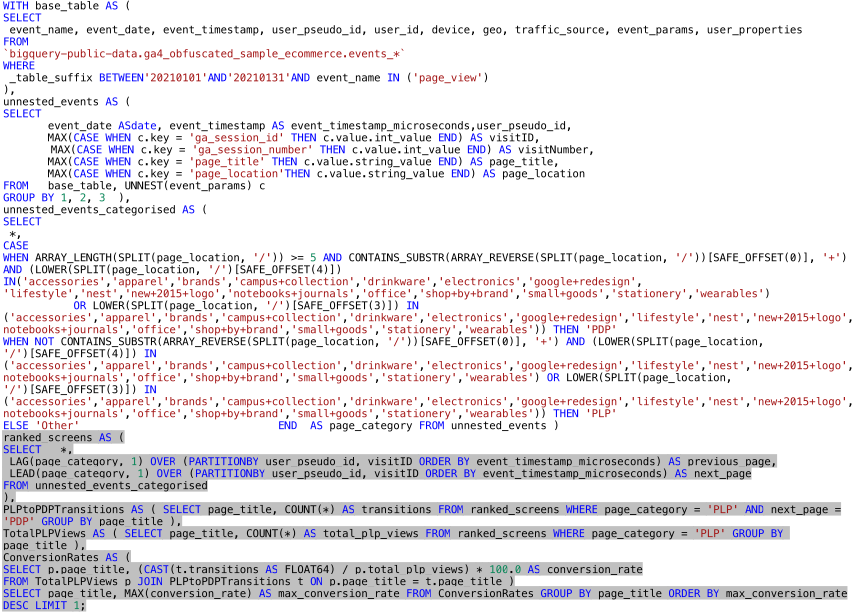
Gold SQL (after rewriting), Table 15 — Lei et al., Spider 2.0, v2. Source. The highlighting belongs to the original. Select for full size.
The rewrite checks a journey. The added ranked_screens stage orders events within each user’s session and identifies neighboring pages. PLPtoPDPTransitions then counts rows where a listing page is followed immediately by a detail page. TotalPLPViews counts listing views, and ConversionRates divides the transition count by those views for each page title.
The change is therefore more than extra SQL. The first calculation measures the mix of page views; the rewritten calculation measures a specific movement between pages. Both can return a percentage, but they support different business conclusions. An analyst reviewing the assistant should inspect these intermediate counts and the sequence rule, not just the final percentage.
Check the example before reusing it. The displayed rewritten SQL selects the whole of January 2021 and returns the highest-rate page, while the written task asks about January 2. They are useful for understanding the transformation, but copying them does not give you a verified answer to the stated task. Agree the date window and requested output, then validate the query against a small known sample.
The paper includes successful cases as well as failures. In a patents-analysis example, the agent encounters a database error because it applies a date function to an integer field. It investigates and revises the query through multiple attempts before obtaining the answer. Execution feedback gives it a concrete signal that something is wrong and an opportunity to correct it.
That is a useful capability. It also helps explain a boundary: the database can reject an invalid operation, but it may happily execute a calculation that answers the wrong question.
In the paper’s calculation and planning error analysis, one query groups trips by their count rather than the required duration. Another sorts by the number of users instead of retention rate. These mistakes concern the analytical plan. A successful run alone cannot detect them.
For the retention question in the opening, a useful test would deliberately make the largest group have lower retention than a smaller one. Then the intended ranking and the tempting wrong ranking produce different answers. If both happen to rank the same group first, the mistake can remain hidden.
This principle extends to the conversion example. Include repeated views, an intervening page and a session without a detail-page visit. Choose records that make competing interpretations visibly diverge. You are testing whether the assistant implements the agreed meaning, not whether it can produce a plausible number.
Spider 2.0's value for a product team is the way it exposes work that a polished SQL demonstration can hide. Data discovery, document interpretation, calculation planning and execution all contribute to the result. They fail in different ways and require different evidence of correctness.
We would ask an assistant to make four things inspectable: the definition it used, the data it selected, the transformations it applied and the result it produced. That does not require a user to read every line of SQL. It requires the product to show enough of the reasoning in concrete artifacts that a reviewer can locate a disagreement.
For example, an approved definition cannot rescue an incorrect page classifier. A correct classifier cannot rescue the wrong sequence rule. Separating those checks makes a failure diagnosable instead of treating the entire answer as an opaque model mistake.
The same separation helps determine what to automate. A team may be comfortable letting the system explore a read-only dataset while keeping approval of a new business metric with an analyst. Autonomy can expand around demonstrated competence rather than around the fluency of the answer.
For a commerce team, we would begin with a defined session-conversion question. Have the metric owner approve the reporting window, page categories, whether conversion requires an immediate transition, and precisely which sessions enter the numerator and denominator. Have an analyst produce a reference result from a fixed sample.
Evaluate three kinds of request. A clear request should produce the agreed calculation. An ambiguous request should cause the assistant to clarify the missing definition. A request involving unusual records should still handle repeat views, missing values and intervening pages correctly.
Retain the event selection, category assignments, session sequences and final counts. Compare them with the reference at each stage. When the final result differs, the reviewer should be able to find the first point of disagreement rather than manually rebuilding the whole analysis.
Keep data permissions and query-cost controls in the database and application. Restricting what an assistant may access does not establish whether its answer is correct. Our guardrails analysis examines that separate question of permitted behavior.
Finally, measure time to a verified answer, including analyst review and corrections. Faster query generation is useful only if the complete process becomes better. Reserve some cases for the final evaluation so improvements are tested beyond the examples used to adjust the workflow.
The researchers also built a collection of database-specific function documentation. Table 17 identifies sources for BigQuery, Snowflake, PostgreSQL, ClickHouse, SQLite and DuckDB; it describes how that collection was assembled, rather than a result showing that documentation solved the tasks.
For an assistant working with your warehouse, make the relevant documentation available alongside the schema and approved business definitions. A BigQuery expression for extracting an event parameter is not automatically the right expression for a different database. Start with the functions and data types used by your evaluation cases, and check that retrieved guidance matches your deployed system. Documentation can explain how to express a calculation; it cannot decide whether the business wanted immediate transitions or eventual arrival.
The LangGraph SQL-agent tutorial demonstrates dedicated steps for database inspection, query generation and checking, with an option to pause before execution for human review. It offers a starting point when the workflow needs more control than a single instruction to generate SQL.
For the conversion evaluation, use an explicit reviewed metric definition and retain each intermediate output. Pause where a new definition or questionable query needs an analyst's decision. The tutorial's database tools are demonstrations; enforce narrowly scoped access through the actual database connection.
Choose this approach when sequencing, visibility and review are the missing capabilities. It cannot determine the correct business definition on your behalf.
The dbt Semantic Layer centralizes metric definitions and uses MetricFlow to support querying them. It is relevant when repeated disagreement or duplicated calculation logic is part of the problem, particularly for a team already using dbt.
For this use case, first establish the correct event transformations and approved metric. Check whether that metric can be represented in your semantic model; do not assume a layer for shared definitions automatically supplies the navigation-sequence logic. Compare the resulting output with the analyst's reference before exposing it through natural-language questions.
A central definition can be consistently wrong. It still needs ownership and verification.
These tools address different needs: one organizes the work, the other helps reuse agreed definitions. A saved query and a review step in your existing application may be enough for the first evaluation. Introduce additional infrastructure when it solves a demonstrated problem.
The adoption decision should concern a defined analytical workflow. Which questions can the assistant answer correctly, what preparation does it require, and how much checking does it leave to the team?
Spider 2.0 gives a reason to make those questions explicit. The difficult work includes interpreting data and business rules, not just generating syntax. Its failures suggest concrete acceptance cases, while its successes show where execution feedback can help.
We would expand use when the assistant produces verifiable answers with a useful reduction in total effort. If analysts spend the saved time finding subtle errors, improve the definitions, intermediate checks or task boundaries before offering broader autonomy.
The result worth trusting is an answer whose meaning and origin the team can explain.
Spider 2.0: Evaluating Language Models on Real-World Enterprise Text-to-SQL Workflows — Fangyu Lei and colleagues. Version 2, March 17, 2025. Read the full original research at the link.
Examine the numerical and behavioral checks behind AI-assisted legacy-code migration.
Weigh faster configuration search against preparation cost and achieved database performance.
Compare prompts using representative tasks and evaluation examples held out from optimization.