LLM confidence can help route uncertain answers even when its percentages are misleading. Learn how abstention changes errors and completed work.
Figures open at full size. Wide tables scroll sideways.
A model can assign a very high probability to an answer and still be wrong. That makes a raw confidence score a poor number to put beside a response as if it were a verified likelihood of correctness.
But an unreliable percentage can still contain useful information. If wrong answers tend to receive lower scores than right answers, the score may help decide which cases need review. The question changes from “Can we trust 95% confidence?” to “Can this signal help us avoid the mistakes that matter?”
Research from UC Berkeley examines that distinction across 15 chat models and five multiple-choice datasets. It finds that the models’ answer probabilities are poorly calibrated, yet often help distinguish correct from incorrect answers. A simple rule for declining low-scoring answers improves a benchmark score that penalizes mistakes. The improvement varies substantially by model, and sometimes comes with a large reduction in the work the model completes.
The study’s setup is deliberately constrained. Each question has a fixed set of answer options and one correct answer. The researchers inspect the probability assigned to each answer letter, normalize those probabilities across the available options, and select the highest one. They call that value the maximum softmax probability, or MSP.
This is different from asking a chatbot, “How confident are you?” It is also different from assigning a probability to the truth of a whole paragraph. The signal comes from the model’s preference among the answer tokens in this particular task.
The main experiments cover 13 open-weight chat models and two models accessed through an API, using two prompt phrasings across five datasets. The questions span areas such as science, general knowledge, commonsense completion and pronoun resolution. The open-weight models were run with 4-bit quantization. These are the configurations tested in the paper, not a ranking of today’s models.
The authors ask two separate questions:
Those questions require different product decisions. The first matters if you want to communicate an estimated probability to a user. The second matters if you want to route uncertain cases elsewhere.
Consider the authors’ simplified illustration: a model assigns 90% to every correct answer and 80% to every wrong one. Neither percentage accurately describes how often those answers are right. Yet a cutoff between the two would separate them perfectly.
Real models are not that tidy. Correct and incorrect answers overlap. The illustration explains why poor calibration does not automatically make the score useless.
The original calibration chart shows the first problem. Its horizontal axis is the model’s answer probability; its vertical axis is the fraction of answers that were actually correct. A calibrated model would track the diagonal. Curves below it indicate overconfidence.
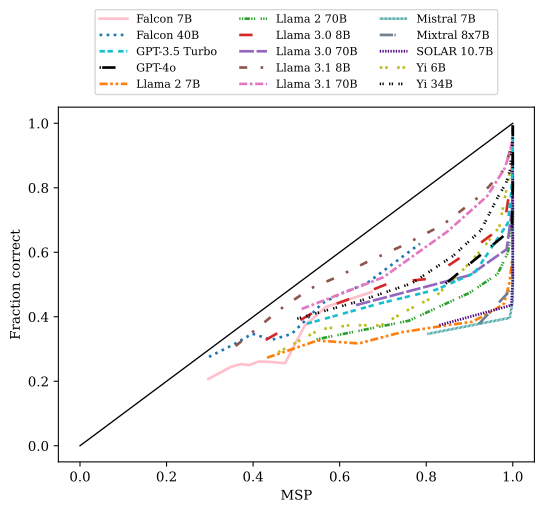
Original Figure 2, left panel, from Plaut and colleagues. Higher answer probabilities often accompany higher correctness, but the percentages themselves overstate reliability. Source figure.
The paper then checks whether the scores can rank correct answers above wrong answers. That relationship is stronger for models that perform better on the underlying question-answering tasks. However, the corresponding improvement in calibration is not established for the chat models: getting more questions right does not mean their raw percentages become dependable probabilities.
The relationship also depends on the task. WinoGrande, which tests which person or thing a pronoun refers to, is substantially harder for correctness prediction than the other datasets. A confidence rule that is useful on general knowledge questions can be much less informative on a different kind of decision. This is a reason to evaluate the actual workload, not simply borrow a threshold from a model card or another team.
The abstention experiment takes the score and applies a simple policy: keep the answer above a threshold; otherwise decline to answer.
To choose the threshold, the researchers sample 20 labeled questions from each of the five datasets. For each model, they use those 100 examples to choose one threshold across the datasets, then evaluate it on the remaining questions. The model is not retrained to know more. The policy decides when to use the answer it already produced.
The experiment gives a correct answer one point and an abstention zero. A wrong answer costs either one point in the balanced setting or two in the conservative setting. The total is divided by the number of questions and multiplied by 100. These are utility scores reflecting a chosen cost of mistakes, not accuracy percentages.
| Balanced | Conservative | |||||
| LLM | No abstain | MSP | Max Logit | No abstain | MSP | Max Logit |
| Falcon 7B | -0.7 | -7.8 | ||||
| Falcon 40B | 2.0 | 0.1 | ||||
| Llama 2 7B | 0.6 | -1.3 | ||||
| Llama 2 70B | 20.7 | 6.5 | ||||
| Llama 3.0 8B | 23.9 | 11.9 | ||||
| Llama 3.0 70B | 58.7 | 46.3 | ||||
| Llama 3.1 8B | 29.2 | 17.6 | ||||
| Llama 3.1 70B | 62.8 | 49.9 | ||||
| Mistral 7B | 16.8 | 1.9 | ||||
| Mixtral 8x7B | 40.3 | 15.8 | ||||
| SOLAR 10.7B | 36.7 | 12.4 | ||||
| Yi 6B | 9.6 | 5.8 | ||||
| Yi 34B | 41.2 | 22.5 | ||||
| GPT-3.5 Turbo | 36.3 | – | 28.3 | – | ||
| GPT-4o | 73.9 | – | 61.1 | – | ||
Original Table 4. The conservative columns give a wrong answer twice the penalty used in the balanced columns. MSP is the answer-probability threshold; Max Logit uses the model’s underlying pre-probability score. Original table.
Two examples reveal why both benefit and coverage matter. GPT-3.5 Turbo’s conservative score rises from 2.6 without abstention to 28.3 using MSP. In the accompanying abstention table, that policy declines 47.6% of questions. It avoids enough wrong answers to improve the selected score, but almost half the workload still needs another outcome.
GPT-4o’s conservative score moves only from 60.7 to 61.1, with 0.4% abstention. Its baseline is much stronger, leaving less room for this particular rule to help. At the opposite extreme, the conservative MSP rule for Mistral 7B abstains on every question. A score can improve while the system ceases to provide answers at all.
The useful outcome is therefore not the largest score increase in isolation. It is an acceptable combination of wrong automatic answers, completed work and escalation cost. The paper shows that a relatively small labeled sample can help in this benchmark; it does not establish that 100 examples are sufficient for every production workflow or rare failure mode.
A suitable first application is a bounded classification decision with known labels: mapping a request to a support queue, selecting a documented category, or choosing among a short set of approved actions. That resembles the experiment more closely than evaluating the truth of an unrestricted answer.
Imagine applying the policy to support routing. For each historical ticket, retain the selected category, its score and the correct category established by review. Use one portion of the data to choose a cutoff. On a separate portion, measure wrong automatic assignments and the percentage sent to a person. Then compare the result with the current routing process.
The important step is defining what happens below the cutoff. A second model, a clarifying question and human review have different costs and failure modes. An “uncertain” flag that nobody acts on does not reduce the impact of a wrong answer.
Treat a model, prompt or label-set change as a reason to recheck the policy. The score depends on the available answer options and how they are presented. Adding categories or changing tokenization can change the signal even when the business task looks similar.
This approach also solves a different problem from checking agreement among several models. One uses the ordering of a single model’s answer scores; the other uses disagreement between models. Compare both with the simplest viable baseline before paying for additional calls or coordination.
The authors’ public repository contains the evaluation and analysis code, results and figures. It is the best starting point for understanding how their experiments obtain scores and compare threshold policies. Reproducing the task-specific extraction is more important than recreating a polished confidence display.
For a locally hosted model, Hugging Face Transformers’ generation interfaces provide options for returning generation scores. Your implementation still needs to identify the correct answer position and option tokens, and reproduce the paper’s normalization over those options. A score attached to some other generated token is not the same measurement.
An existing evaluation pipeline can store the labeled examples, sweep candidate thresholds and report the resulting error-versus-coverage tradeoff. Keep the threshold-selection data separate from the final evaluation data. If the interface does not expose the required probabilities, asking the model to state its confidence is a different method and needs a separate evaluation.
If the product needs meaningful displayed percentages rather than a routing rule, calibration is an additional task. The paper’s appendix tests rescaling the scores using labeled data and finds reduced calibration error, but not perfect calibration. A useful cutoff is not, on its own, permission to show “95% likely to be correct.”
The strongest lesson is that uncertainty can be useful before it becomes a trustworthy percentage. A score that helps identify weaker answers can support an operational decision even when it should never be shown to a customer as a probability of truth.
Start with a measurable, bounded task and an explicit fallback. Adopt the rule only if it reduces consequential mistakes while leaving enough useful work completed. A system that confidently guesses and a system that refuses everything can both fail the business; the research helps make the space between them testable.
Probabilities of Chat LLMs Are Miscalibrated but Still Predict Correctness on Multiple-Choice Q&A, Benjamin Plaut, Nguyen X. Khanh and Tu Trinh. arXiv version 4, revised 7 August 2025; published in Transactions on Machine Learning Research. This article uses the revised 15-model study, not the earlier 10-model preprint.
Consider when agreement between models adds evidence and when it repeats the same mistake.
Explore how inspection teams can identify predictions that need a second look.