Explore graph features for Ethereum scam detection, the limits of eleven scam labels, and the tests needed before trusting a contract-risk model.
Figures open at full size. Wide tables scroll sideways.
A smart contract's transactions reveal relationships that its code alone cannot: which accounts interact with it, how funds move through its neighborhood and where it sits in the wider network. A paper by Yihong Jin, Ze Yang and Xinhe Xu explores whether those relationships can help identify suspicious contracts.
Its most interesting comparison is between a conventional neural classifier fed graph-derived features and a graph convolutional network that also processes connections between contracts. The simpler classifier reports better results.
That finding is worth investigating. It is not enough to establish a dependable fraud detector. The processed dataset contains only eleven contracts labeled as scams, and the paper leaves important evaluation details unresolved. For teams building contract-risk tools, the useful question is what to reproduce before trusting the reported advantage.
The researchers begin with Ethereum transaction data and represent accounts as nodes and transactions as directed connections. They distinguish ordinary externally owned accounts from smart-contract accounts.
They then compute characteristics of each node's position: incoming and outgoing connections, PageRank, hub and authority measures, connectivity, shortest-path summaries and transaction value. These are engineered descriptions of transaction behavior. The method does not eliminate feature engineering; it moves part of that work into network analysis.
The next step is distinctive. Because the scam labels concern contracts, the researchers aggregate information from the ordinary accounts around each contract into its feature representation. A contract's input can therefore reflect the neighborhood through which it receives or sends activity, rather than only its own isolated totals.
Once that information is in a feature vector, an ordinary multilayer perceptron, or MLP, can classify it. The classifier does not need the full graph as a separate input: some network information has already been summarized into its features.
For the graph convolutional network, or GCN, the researchers additionally connect contracts that share neighboring ordinary accounts. The GCN can combine information across that reconstructed contract network. This creates a meaningful comparison: does an additional graph-processing stage help once neighborhood information is already present in the inputs?
The paper's methods and experiment describe a processed set of 3,409 contract nodes, with eleven positive scam labels. That imbalance dominates the learning problem.
For the MLP, the authors use SMOTE to generate additional minority-class examples and edited nearest neighbors to remove selected noisy examples. They report a resulting dataset of 3,130 positive and 3,271 negative samples. For the GCN, they describe oversampling minority-centered subgraphs while retaining graph structure.
The distinction is essential: synthetic examples do not represent thousands of newly investigated scams. They are derived from the small amount of labeled evidence already available. They may help training, but they do not expand the diversity of independently verified fraud cases by the same amount.
The paper reports an 80/20 training/test split. The models also have different configurations and training budgets: the MLP uses two layers and 5,000 epochs, while the GCN uses six layers and 500 epochs. This is a comparison of the reported setups, not an experiment that isolates graph aggregation as the only changing factor.
The original results table reports 92.5% accuracy for the MLP versus 88.7% for the GCN. It also reports an F1 score of 90.5% versus 83.8%. F1 summarizes the balance between correctly flagging scams and finding labeled scams; it should not be read as the percentage of future scams the service will stop.
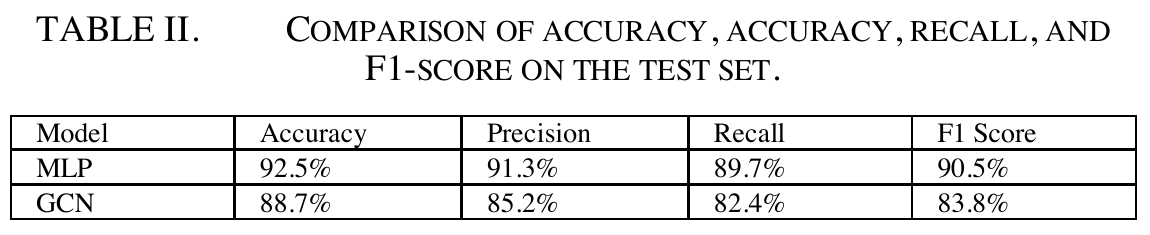
The authors suggest that the engineered features already capture useful topology, making further graph aggregation redundant. That is a plausible explanation of their result, rather than a demonstrated general rule that MLPs outperform GCNs in fraud detection.
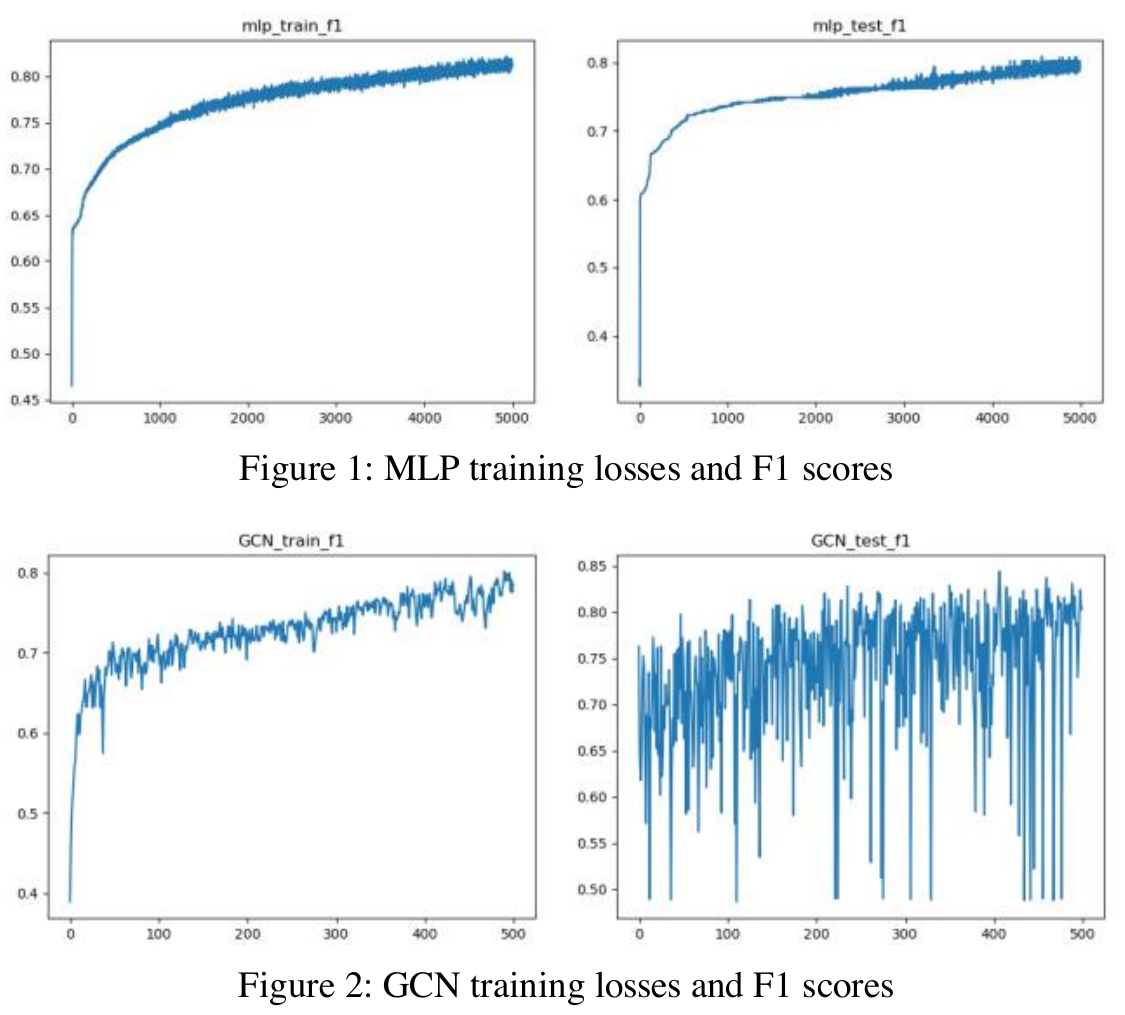
The original training plots add a reason for caution. The MLP test curve appears to finish around 0.80 F1, while the table reports 0.905. The paper does not explain how those presentations relate. The GCN test curve is visibly more variable. Both deserve investigation in a reproduction rather than choosing whichever presentation looks stronger.
Were synthetic examples kept out of the test evidence? The paper describes resampling and a split but does not clearly establish their ordering or give the test set's original positive-case count. That matters because generating related examples before splitting can allow information to cross the evaluation boundary. This is an unresolved detail, not a finding that leakage definitely occurred.
Does the model work on genuinely new activity? A useful contract-risk system must evaluate a contract using transactions available at the scoring time. The paper does not establish a forward-in-time test that rules out later information or demonstrate broad generalization from the small labeled set.
Can the alerts support an operational decision? A test on a rebalanced dataset does not tell a team how many false alarms it will receive in a stream dominated by ordinary activity. The paper's small collection of external case checks does not supply that missing prospective evaluation.
These limitations change the next step. The research supports investigating graph features and testing a simpler classifier before adding complexity. It does not support assigning production trust ratings directly from the published scores.
A reasonable initial application is to rank contracts for investigation, with the underlying transaction evidence available to the reviewer. A score could prioritize attention while preserving the distinction between suspicious patterns and a verified finding.
To evaluate that application, freeze the scoring date and build each feature from information available before it. Separate later contracts or relevant entities for evaluation, keep independently verified labels identifiable and measure how many alerts analysts can investigate at the chosen threshold.
Compare the graph-feature classifier against the team's current rules and a simple tabular baseline. Record missed cases as well as false alerts. If a GCN adds no reliable improvement under the same evaluation conditions, its additional operational complexity needs another justification.
This follows the same information-timing principle discussed in our guide to prediction data pipelines: a historical dataset must not silently supply knowledge unavailable at the actual decision time.
NetworkX's link-analysis tools offer PageRank and HITS for a bounded prototype. They can help reproduce the feature idea before committing to a new serving architecture. Existing warehouse calculations may already provide simpler connection and transaction aggregates.
For the classifier comparison, PyTorch Geometric represents node features and graph connections explicitly. Use it when testing whether message passing contributes beyond the tabular features. Keep the feature construction, evaluation boundary and label definitions comparable across alternatives.
If resampling is necessary, follow imbalanced-learn's leakage guidance: apply it within training, preserve an untouched evaluation set and test under the class distribution relevant to use. Resampling can support a learner; it cannot manufacture independent evidence about new scam types.
The strongest idea here is the graph-feature baseline. A team may gain useful transaction context without making a graph neural network the center of its product.
The evidence is too thin and internally unclear to recommend deployment on the strength of this paper. A reproducible comparison with more verified cases, explicit resampling boundaries and a forward-in-time evaluation would change that assessment. Until then, this is a research lead for analyst assistance, not a basis for automatically declaring contracts safe or fraudulent.
Yihong Jin, Ze Yang and Xinhe Xu, Scam Detection for Ethereum Smart Contracts: Leveraging Graph Representation Learning for Secure Blockchain. Version 5, 19 March 2025. Limited original figure and table excerpts are reproduced with attribution for discussion of the method and its evidence.
Look beyond a high intrusion-detection score to attack classification and operational alert volume.
Examine how relevance and trust affect responses to AI-generated phishing messages.