Learn when AI fairness metrics mislead, how causal paths change an audit, and how to use Fairlearn and DoWhy without overstating the evidence.
Figures open at full size. Wide tables scroll sideways.
A hiring model selects one group more often than another. The gap is real in the observed data. What caused it—and what should change—is a harder question.
Perhaps the model uses a protected characteristic directly. Perhaps another input carries the same information. Perhaps the audit includes only a selected subset of applicants, making its comparison misleading. These explanations call for different investigations. A single fairness score cannot distinguish them.
Ruta Binkyte, Ljupcho Grozdanovski and Sami Zhioua examine this problem in a paper connecting causal analysis with AI auditing and legal evidence. Their contribution is a framework for reasoning about discrimination, rather than a new model that has been shown to eliminate it. For teams responsible for consequential automated decisions, the useful lesson is to make the audit's assumptions explicit before treating its numbers as an explanation.
An analyst might try to make a comparison fairer by controlling for every available variable. The paper explains why that can fail: the role of a variable matters more than whether it is available.
A variable can be a shared cause of two others, an intermediate step through which an effect travels, or a consequence of both. Those three roles are called a confounder, a mediator and a collider. The names are less important than the different decisions they require.
The authors' original diagrams show the distinction. Arrows represent assumed causal relationships. They are hypotheses about how the situation works, not proof established by drawing the graph.
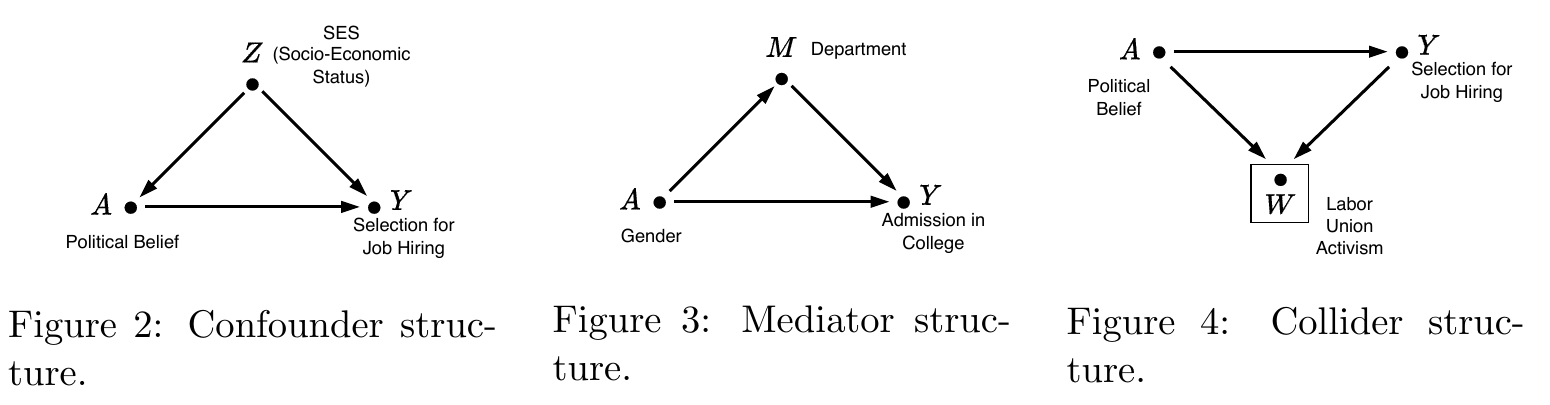
In the paper's hypothetical hiring example, socioeconomic status influences both political belief and access to opportunities that affect hiring. Comparing hiring rates by political belief therefore mixes together multiple relationships.
If the audit asks about the causal effect of political belief, socioeconomic status may need to be accounted for under that assumed model. Otherwise, the analysis can attribute to political belief a difference that arises through their shared cause.
This does not establish that the overall hiring process is fair. It narrows one question about one pathway. Other sources of disadvantage still deserve investigation.
The paper next considers university admissions, where applicants choose different departments and departments have different admission rates. Comparing applicants within each department asks a different question from comparing admissions across the institution.
The within-department comparison removes the pathway through department choice. That can help examine decisions made inside a department. It cannot, on its own, resolve whether the processes shaping department choice are acceptable.
For an AI audit, this is the danger of automatically controlling for an input such as education or employment history. If that input carries part of the disadvantage being investigated, holding it constant can remove the very effect the audit intended to measure.
In the third example, the hiring data comes mainly from labor-union records. Both political belief and being hired influence whether someone appears in those records.
Restricting analysis to that group can create an association that would not have the same meaning among all applicants. The problem entered when the dataset was assembled, before a fairness metric was calculated.
The practical question is therefore not only “Which columns do we have?” It is also “Who is missing, and what determined whether their record was included?” The paper's three causal structures explain why the answer affects the audit.
The paper develops its hiring example further by adding home address and community service. Political belief may affect both; both may then affect selection. Socioeconomic status remains a shared cause, and the graph also includes a direct route from political belief to hiring.

The authors use community service as a potentially justifiable explanation in their hypothetical scenario and address as a potentially unacceptable proxy. Those assignments are assumptions of the example. They are not universal rules about which hiring criteria are appropriate.
An auditor can now distinguish three questions. Does political belief affect the decision directly? Does its influence travel through address? Does it travel through community service? Estimating those routes separately is the purpose of mediation analysis.
This is more informative than deleting a sensitive column and declaring the model fair. Removing the direct input can leave indirect routes intact. It is also more demanding: the team must justify the arrows, decide which question it is asking and determine whether the available data can identify the effect at all.
The diagram helps organize that work. It does not choose the acceptable pathways on the organization's behalf.
This paper synthesizes causal concepts, illustrative examples and legal analysis. It does not report a controlled deployment in which the proposed framework reduced discriminatory decisions by a measured amount.
Its contribution is to show how apparently reasonable statistical comparisons can answer different questions or be distorted by data selection. It also connects technical investigation with the need to access evidence about a decision-making system. A person challenging a decision and a team auditing it both need more than a final score.
The authors' discussion of practical limitations is central to using the framework responsibly:
These limits do not make descriptive fairness metrics useless. They explain why an observed disparity, a causal explanation and a judgment about acceptable treatment should be reported distinctly.
For a product or risk team, the first deliverable should be a decision map. Define the outcome, the affected population, how records enter the dataset and which version of the system produced the decisions.
Then write the proposed explanation for each important input. Is employment history a relevant qualification, a pathway carrying earlier disadvantage, or both? What evidence supports that interpretation? Record disagreement rather than quietly selecting the graph that produces the most reassuring result.
Preserve the original group comparisons alongside any adjusted analysis. If the adjusted gap shrinks, explain what was held constant and why. If plausible assumptions lead to conflicting conclusions, identify the additional data or controlled investigation that could distinguish them.
That process produces a more useful output than a binary compliance label: a traceable account of observed harm, candidate mechanisms, supported conclusions and unresolved questions. It also complements the reader-centered approach in our article on AI explanations and independent human judgment: an explanation should help someone evaluate a decision, not merely decorate it.
Fairlearn's assessment workflow starts with the harms and groups to examine, then quantifies and compares outcomes. Use it to organize descriptive assessments, including relevant group intersections. In the hiring example, this could expose differences in selection or error rates that need further investigation. Those comparisons do not establish a causal mechanism.
DoWhy's causal-effect workflow separates modeling assumptions, identifying an estimable effect, estimating it and testing robustness. It is useful once the team has a defensible causal question and graph. Its identification stage matters: choosing a sophisticated estimator cannot recover an effect that the data and assumptions do not identify.
The tools serve complementary purposes. Start with a reproducible dataset and descriptive assessment; document competing causal models; then run only the analyses those models support. Existing analysis code may already cover the first step. No package can settle the normative choices or turn an unsupported graph into evidence.
Causal reasoning earns its place in an AI audit when it makes the question and assumptions clearer. It becomes counterproductive when a complex diagram gives a fragile conclusion the appearance of certainty.
We would judge an audit by whether another informed reviewer can reconstruct its population, assumptions and conclusions—and see what evidence could overturn them. A narrower, defensible finding is more useful than an expansive claim that the system has been proven fair.
Ruta Binkyte, Ljupcho Grozdanovski and Sami Zhioua, On the Need and Applicability of Causality for Fairness: A Unified Framework for AI Auditing and Legal Analysis. Version 4, 19 March 2025. Original figures reproduced under CC BY 4.0. The paper's legal discussion reflects its publication context; this article focuses on its technical audit framework.
Match an explanation method to the decision or challenge a reviewer needs to make.
Ask whether an explanation improves the user’s next unaided decision.