What 108,998 AI product reviews reveal about error recovery, customization and satisfaction—and how to turn the findings into useful product experiments.
Figures open at full size. Wide tables scroll sideways.
When an AI feature fails, can the user recover without losing their work? Can they change the output to suit the task? These are useful questions for an AI product roadmap—and a study of almost 109,000 software reviews gives them empirical support.
The strongest positive association in the study is between favorable discussion of error recovery and higher product ratings. Customization also stands out. The research offers priorities to investigate, not a formula for increasing satisfaction. It analyzes what reviewers wrote and how they rated products; it does not test what happens when a team ships a new feature.
Stefan Pasch and Sun-Young Ha’s study of human-AI interaction asks whether widely used AI design principles show up in user evaluations. It also asks whether professional background changes which aspects people discuss and how those perceptions relate to satisfaction.
The distinction is practical. Engineers might write more about reliability, while marketers discuss customization. That does not automatically mean the two groups need different recovery experiences or value a feature differently when it fails.
The researchers begin with guidance from Microsoft, Google and Apple. They group related principles into seven dimensions: feedback, adaptability, customization, explainability, error recovery, reliability, and privacy and security. They then look for related topics in reviews of AI products on G2.
These dimensions cover the surrounding product experience as well as the model. Error recovery can include undo, autosave, retries and getting a failed job running again. Customization can include settings, formatting and templates. That breadth helps explain why an AI product can produce impressive outputs yet still frustrate its users.
The dataset contains 108,998 reviews across 249 products in G2’s Artificial Intelligence category. Products needed at least 50 reviews to enter the analysis. This is evidence about a selected set of business software products and their reviewers, rather than a representative survey of everyone using AI.
G2 separates what reviewers like from what they dislike. The researchers use that structure to estimate sentiment instead of asking a model to label each whole review positive or negative.
Their process has three main steps. First, a topic model called BERTopic identifies themes in the review text. Second, the researchers match the ten most similar topics to each of the seven design dimensions. Third, they compare the strength of those topics in the “like” and “dislike” sections. More weight on the positive side produces a higher sentiment score. Adding both sides produces a separate measure of how much the dimension was discussed.
The original methodology figure shows these separate inputs converging on the analysis:
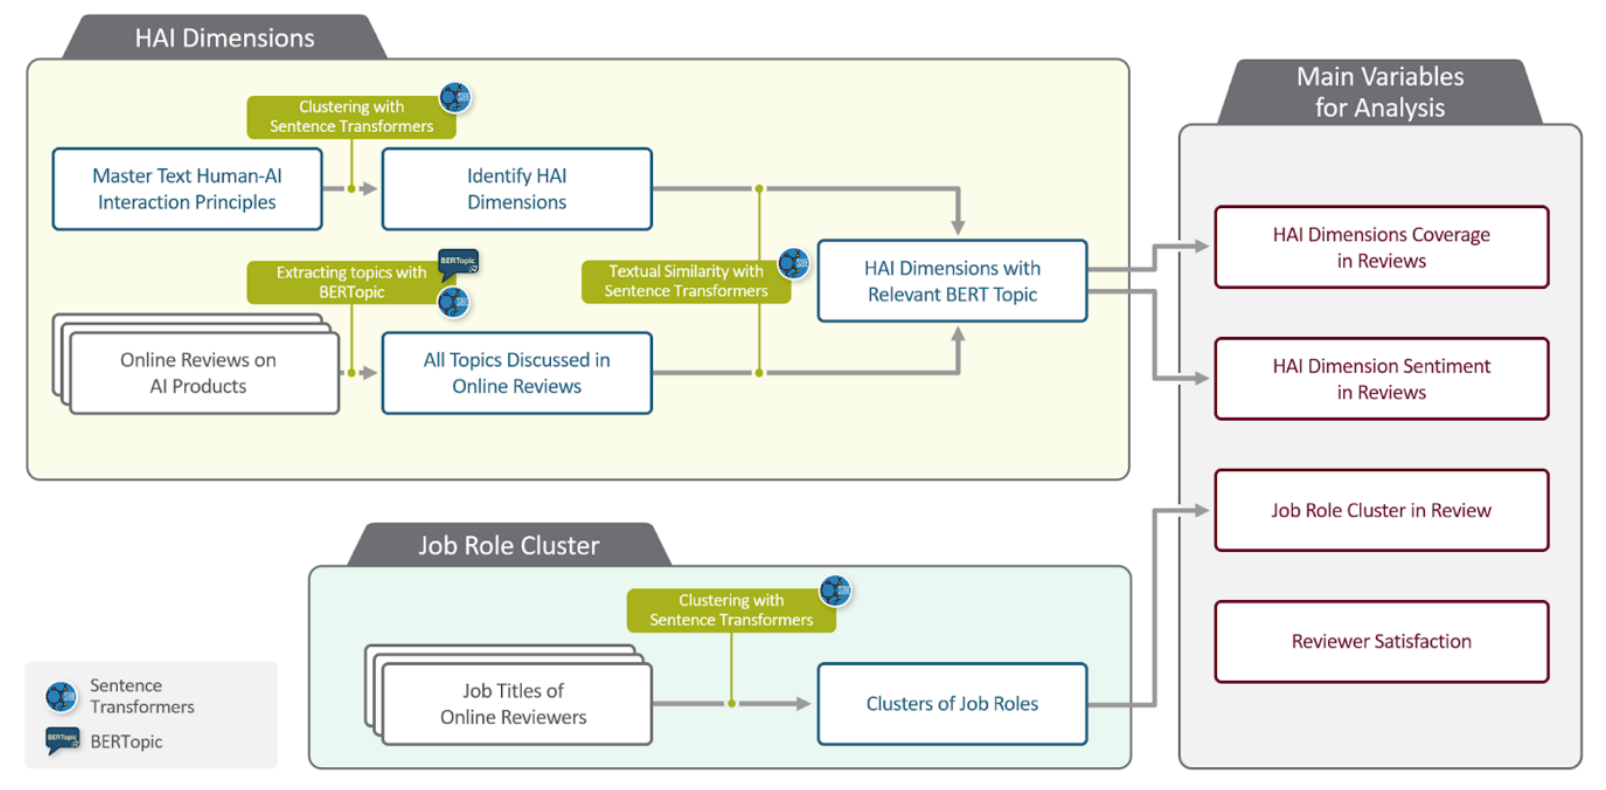
For an illustration, imagine a reviewer praising the ability to undo a generated change while criticizing inflexible formatting. That review could contribute positively to error recovery and negatively to customization. Both topics receive coverage, even though their sentiment differs. This is our example of the measurement logic, not a quotation from the dataset.
That separation is useful for product research. A frequently discussed feature may be a strength or a pain point. Counting mentions alone cannot tell you which.
The researchers relate the seven sentiment measures to ratings on a one-to-five scale. Their second analysis includes controls for product category, company age and company size, using 103,361 reviews.
In that controlled analysis, error recovery and customization have the clearest positive associations. The estimated coefficients are approximately 0.215 and 0.114 rating points for a one-unit change in their respective sentiment measures. Adaptability and privacy/security also have positive estimates, but weaker statistical support: they meet the paper’s 10% significance threshold rather than 5%.
Those numbers describe a relationship between review language and ratings. Adding an undo button is not predicted to raise a product’s rating by 0.215 stars. The study does not observe that intervention, and its sentiment measure is broader than a single feature.

Feedback, explainability and reliability do not show statistically significant associations in this analysis. That is not a reason to remove them from a roadmap. The measurements depend on what users mention and how the topic model classifies their language. A fundamental requirement may matter greatly without appearing in reviews in a way this method captures.
The controlled model explains about 2% of the variation in ratings. Price, output quality, service, expectations and many other influences can still matter. This result is a reason to investigate recovery and control within your product—not to build a satisfaction scorecard from seven coefficients.
The topic lists in Appendix B are especially useful. Error recovery includes debugging, crashes, downtime, autosave and job restarts. These are concrete experiences a product team can inspect.
Other mappings are less clean. Topics assigned to explainability include general language-model terms, conversational AI and embeddings. Some topics also appear under more than one dimension. Consequently, the study’s “explainability” measure is not a direct audit of whether users received understandable explanations for individual decisions.
This is a consequential limit, not a reason to discard the study. It tells you to read actual complaints before converting a statistical category into a feature requirement. A review about installation failures and a review about correcting an incorrect answer may both contribute to recovery-related discussion, but they point to different engineering work.
Technical reviewers discuss some system-oriented dimensions more often than the reference group labeled “writers,” and feedback and customization less often. The reported differences are small. When the researchers test whether job groups change the sentiment–rating relationship, they find no significant interactions for the technical group. One marketing/explainability interaction remains after their multiple-comparison correction.
The study therefore gives little support for assuming that engineers and other users need fundamentally different satisfaction strategies. It also does not prove their preferences are identical. The job-title appendix contains mixed groups: for example, the technical cluster includes content writers. Job titles are an imperfect shortcut for understanding someone’s task and expertise.
For a product team, the most useful next step is to examine the path from a mistake to a completed task. Can a person identify what went wrong, correct it, preserve valid work and continue? Does the product remember an approved preference without forcing repeated setup?
Those questions connect the study’s strongest findings to observable behavior. They are also more precise than “make the AI trustworthy.” A user who can repair a formatting error in seconds faces a different experience from one who must restart an entire document.
Our reading is that recovery deserves its own product surface and evaluation. It should not be left as an apology message after the model fails. Related guardrails research raises a complementary question: whether protective behavior itself prevents users from completing legitimate work.
Take an AI writing or document-editing feature. Select a common task and a plausible failure: the system changes an important detail while revising a passage. Observe the current recovery path before designing a replacement. Does the user notice the change? Can they restore the detail without losing other edits? Can they tell whether the repair worked?
Build a version that preserves the prior state, makes the affected change visible and offers a focused correction. Compare it with the current interface using the same task and failure. Measure successful task completion, time spent recovering, repeated attempts and the user’s assessment of the experience. Check ordinary successful tasks too: a recovery design that constantly interrupts good work may create a new problem.
This proposed test follows the research’s signal without pretending that the paper ran it. It can produce the causal evidence your own roadmap needs. If the interface improves reported satisfaction but users still fail to complete the task, it has not solved the underlying issue.
For customization, make a similarly narrow choice. Let users save an approved output format or vocabulary preference, then test whether it reduces repeated correction. Shared products need an additional boundary: whose preference applies when several people collaborate? Our analysis of multi-user personalization explores that conflict explicitly.
Use Microsoft’s HAX Toolkit to structure the design review. Its guidelines, workbook and playbook help teams reason about human-AI interactions and anticipate failures. Start with one task, list likely misunderstandings or incorrect outputs, and specify how the user dismisses, corrects or recovers from each. The toolkit supports design decisions; it is not a runtime reliability guarantee.
Use a small, manually checked feedback sample before automating analysis. Keep positive and negative observations separate and record the concrete task behind each. Have reviewers inspect ambiguous examples rather than forcing every complaint into one of seven labels. For a modest feedback volume, a shared table and a consistent labeling guide can be sufficient.
BERTopic becomes useful when feedback volume makes manual exploration difficult. Its official documentation describes the embedding, clustering and topic-representation workflow. Use it to discover recurring themes, then inspect representative reviews and validate the labels. It is a research tool for finding patterns, not proof that a topic causes churn or that every sentence under a topic describes the same failure.
The paper is most valuable as a prompt to investigate neglected parts of an AI product: repair, control and adaptation to the task. The recovery association is stronger than a generic claim that users like “human-centered AI,” because it points to experiences teams can inspect and improve.
We would use the findings to choose questions for product experiments, then let task completion and observed recovery behavior determine investment. We would not use them to promise retention gains, deprioritize reliability or infer a user’s needs from their job title alone.
Human-AI Interaction and User Satisfaction: Empirical Evidence from Online Reviews of AI Products, by Stefan Pasch and Sun-Young Ha. This article uses arXiv version 2, dated March 25, 2025. The original methodology figure and results table are included for analysis and attributed to the authors.
Explore why remembering a preference is different from applying it appropriately.
Ask whether an explanation improves the user’s next unaided decision.