How drone imagery becomes georeferenced vehicle trajectories, what the Songdo validation establishes, and how to test accuracy before traffic analysis.
Select a figure to open it at full size.
A video can show a queue forming without telling a transport planner how long drivers wait, where vehicles change lanes, or whether a proposed junction redesign addresses the problem. Answering those questions requires a record of each vehicle’s movement in real-world coordinates. Detecting cars is only the beginning.
Robert Fonod and colleagues built a pipeline for that harder task and applied it across 20 intersections in Songdo, South Korea. Their study combines a trained vehicle detector with tracking, camera-motion correction and geographic alignment. It produced nearly 690,000 trajectories from four days of drone recordings. The useful contribution for transport analytics teams is the explanation of how those measurements are constructed—and where their accuracy remains uncertain.
A hovering drone still moves. Wind and small changes in orientation shift the road within the image. If software treats those shifts as vehicle motion, it can invent movement in stopped traffic or distort a car’s speed. Flights over the same intersection also begin from different positions, so yesterday’s pixels do not necessarily identify today’s lane.
The researchers address these problems in stages. First, they split 12 TB of recordings into usable hovering segments. Human annotations from the Songdo imagery help train a YOLOv8s vehicle detector. A multi-object tracker then connects detections across successive frames, giving a vehicle a continuing identity within a track.
The important ordering choice is to correct the tracks after detection and tracking, rather than first warping every video frame. This lets the system transform the smaller set of vehicle coordinates. It also avoids making the detector work on a succession of resampled images. The authors explain this sequence in their trajectory extraction methodology.
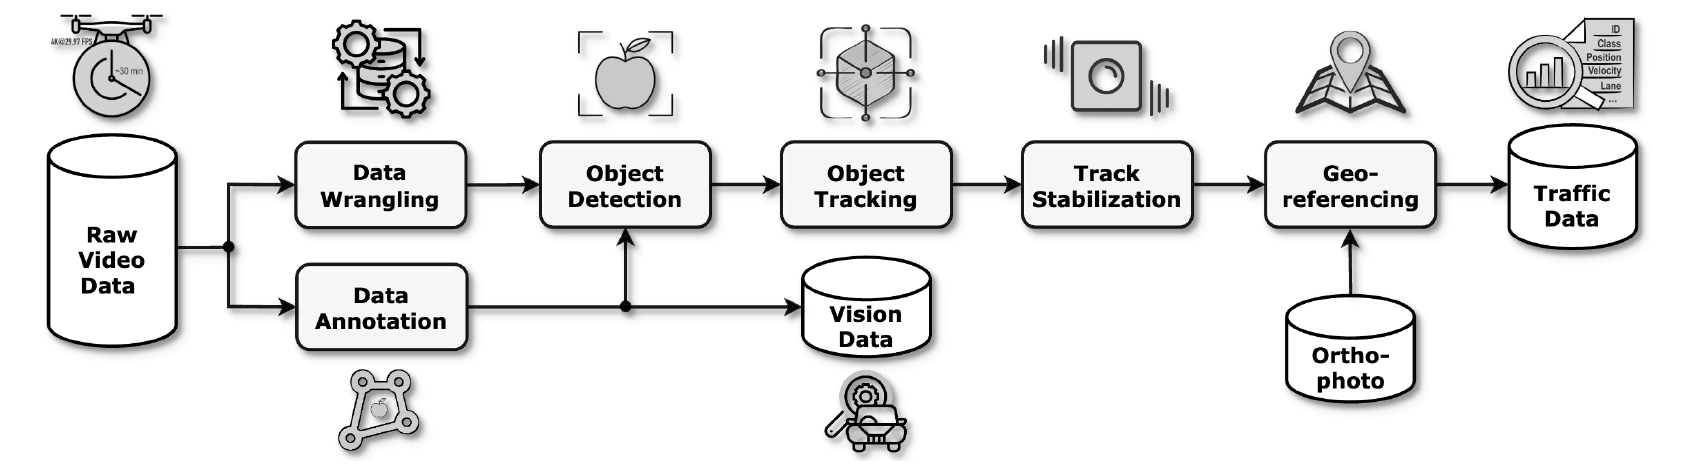
For stabilization, the software finds matching background features between a frame and its reference. Moving vehicles are masked out so they do not become anchors for estimating camera motion. Each frame is aligned to the initial reference rather than accumulating a chain of small corrections. That matters because small errors in a long chain can become a large displacement.
This gives a stable image coordinate system. It does not yet give metres, geographic positions or comparable tracks across flights.
Consider two flights viewing the same junction from slightly different angles. A car beside a lane marking appears at different pixel locations in each video. The pipeline maps each video’s reference frame to a common master image for that intersection, then aligns the master to an orthophoto—a geographically referenced overhead image. The orthophoto supplies the final conversion into world coordinates.
The original Figure 10 makes this intermediate step visible. Red connections align the video with the master; blue connections align the master with the orthophoto. Only after these transformations do the drawn trajectories belong on a geographic map.

The team also draws road sections and lanes so tracks can be associated with a particular approach or movement. That annotation took about 50 working hours in this study. The resulting dataset is a combination of learned perception, geometric processing and human map preparation. Treating it as an off-the-shelf car detector would miss much of the work needed to reproduce it.
Adding the Songdo training images raised the detector’s reported mAP@50 from 0.742 to 0.951. This metric checks how well predicted vehicle boxes match annotated boxes. It does not mean that 95.1% of complete trajectories, speeds or lane assignments are correct. Those outputs depend on later stages too.
The authors therefore compare extracted tracks with an instrumented vehicle carrying RTK-GNSS positioning equipment. Its 15 passes through nine intersections provide a more relevant check of the final measurements. Mean positional differences range from 0.241 metres at intersection G to 1.879 metres at L. Most mean speed differences are within roughly one kilometre per hour; M is slightly outside that range.
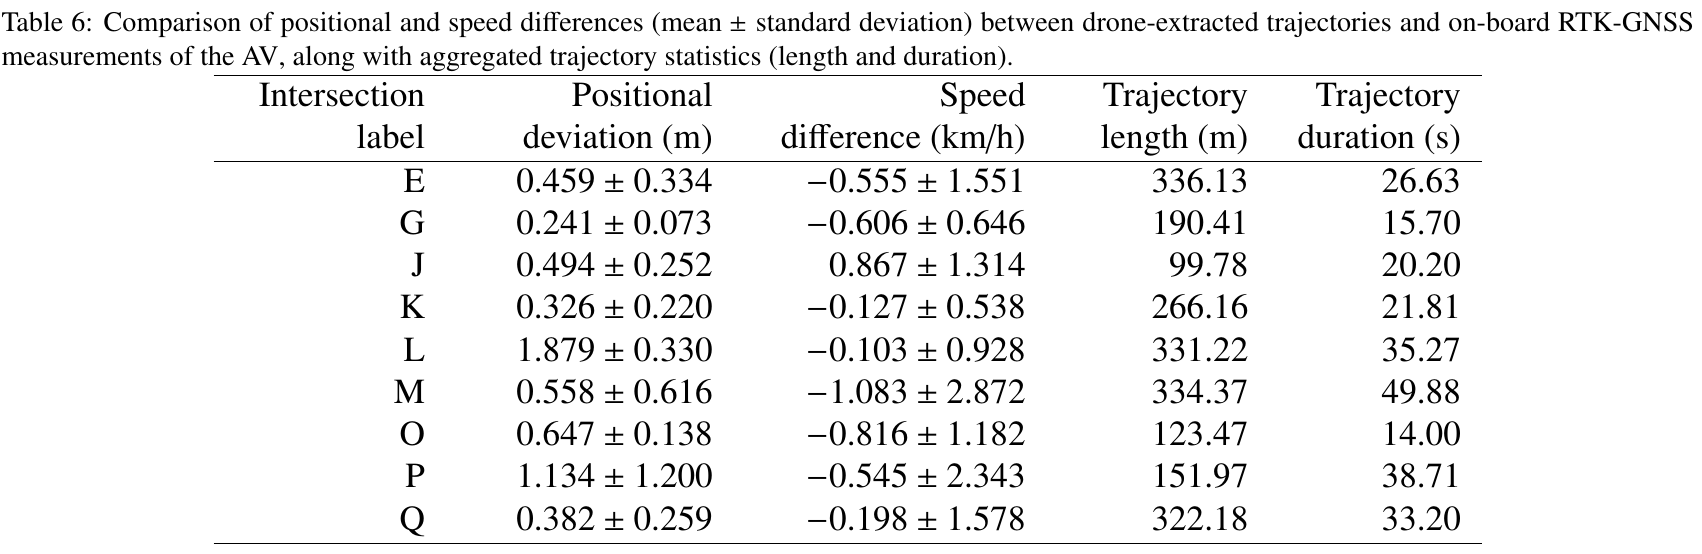
That distinction matters. The drone and vehicle clocks were not synchronized, and the comparison uses a spatial matching procedure. Satellite positioning can also be affected by the surrounding buildings. Replacing the orthophoto reduced discrepancies at the two weakest locations, but did not eliminate them. The study cannot assign all remaining disagreement to either the drone pipeline or the vehicle’s receiver.
There is another reason to avoid treating this as independent certification: the trajectory smoothing setting was selected using the probe vehicle data. A new deployment should reserve separate runs for final validation after choosing its settings.
The appendices describe problems that a headline trajectory count conceals. About 2% of videos needed trimming after alignment checks, and roughly 1% needed splitting because tracking identities restarted. Short tracks are removed; vehicles can also receive multiple identities when tracking breaks or recordings overlap. A count of trajectory identifiers is consequently not a count of unique cars across the city.
For a planning team, these details change how the dataset can be used. A credible queue-length study might tolerate some identity fragmentation while a study of individual route choice cannot. An average speed can look reasonable even when a short, erroneous jump creates a false near-collision. Acceptance tests need to reflect the intended analysis, rather than relying on one detector score.
The appendix goes further: derived kinematic estimates are primarily suitable for preliminary filtering, rather than precise dynamic analysis. Bounding-box changes, shadows and smoothing can distort them. Tall vehicles can also be assigned to the wrong lane because their apparent image centers shift with perspective. A safety study using acceleration or close interactions therefore needs additional validation beyond the dataset’s aggregate checks.
The same separation between detecting a feature and validating the final decision appears in our coverage of AI-assisted infrastructure inspection.
The authors’ Geo-trax project now packages detection, tracking, stabilization and optional orthophoto-based georeferencing. It is the most direct starting point for reproducing this approach. Its current implementation has evolved since the paper; pin a version and record the detector weights, tracker configuration and map inputs before comparing results.
Start with one intersection and a small collection of flights that vary in angle, congestion and lighting. Retain the unprocessed recordings and inspect tracks overlaid on the original video. Check stationary objects for apparent motion, inspect identity changes around occlusions, and compare known road markings with the geographic output. Then validate speed and position on additional probe runs that were not used to tune smoothing or alignment.
Keep a simple counting baseline. If the only question is how many cars turn left, a full geographic trajectory pipeline may add cost without improving the answer. If the question involves lane changes, acceleration or interaction between vehicles, the additional stages become more valuable. Processing time, human annotation effort and rejected footage all belong in that comparison.
This is substantial applied AI research because it follows the measurement beyond object detection. The strongest contribution is a reproducible chain from aerial observations to geographically aligned tracks, accompanied by real validation and documented imperfections.
For a city or mobility team, the next step is a bounded measurement project with explicit accuracy requirements. The paper supports that investment in evaluation; it does not establish continuous real-time city management or automatic reductions in congestion.
Advanced computer vision for extracting georeferenced vehicle trajectories from drone imagery, Robert Fonod, Haechan Cho, Hwasoo Yeo and Nikolas Geroliminis. Version 3, June 25, 2025. The figures and table reproduced above are from this version.
Examine which parts of a traffic-response workflow an LLM should support or decide.
Consider the accuracy and latency tradeoff in identifying objects from 3D data.