A research-led guide to choosing financial AI explanations: feature attribution, attention, interpretable models and tests of real reviewer value.
Figures open at full size. Wide tables scroll sideways.
A credit model can identify the inputs that pushed a score down and still leave the important question unanswered: is the decision sensible, can a reviewer challenge it, and would changing an input actually help the applicant?
Those are different questions. For technical and product leaders building financial AI, choosing an explanation method starts with deciding which one the product must answer.
A review by Md Talha Mohsin and Nabid Bin Nasim maps how financial research uses explainable AI, including feature attribution, attention mechanisms and interpretable models. Its useful contribution is that map. It does not demonstrate that adding an explanation makes a lending model fair, a trading strategy profitable, or a customer more trusting.
The authors searched Scopus for combinations of finance and explainability terms. They report narrowing 6,086 initial results to 30 selected studies, organized across seven areas including credit scoring, fraud detection, risk management and trading. The work combines analysis of publication patterns with a catalogue of the methods used in individual studies. It is a literature review, not a new model evaluated on a common financial dataset. The selection process is described in Section 3.
The selection diagram matters because it tells us how to read the later charts. The authors intentionally concentrate on influential work. The prose describes a filter of at least 50 citations; the diagram also permits highly ranked journals and key framework papers. Newer or less cited approaches can therefore be underrepresented.

There are also inconsistencies in the reporting: the appendix labels one included work an arXiv preprint despite the stated exclusion of preprints, and includes an entry dated before the stated 2015 starting point. These do not erase the methods catalogue, but they make precise claims about coverage or trends less secure.
Treat the review as a starting list of approaches to investigate. It is not evidence that the most frequently mentioned approach is the best choice for your product.
The research brings together methods that operate at different points in the modeling process. Putting them under one “explainable AI” label can hide the most consequential design choice.
Explain an already trained model. Feature-attribution methods assign contributions to the inputs behind a prediction. In a credit application, this can help a reviewer inspect whether payment history, indebtedness or another recorded input influenced a particular score. The review's credit-risk examples combine tree models with Shapley-value explanations and related network analysis.
The important distinction is between explaining one prediction and summarizing a model across many cases. A feature that matters on average may contribute little to the particular applicant being reviewed. A global importance chart cannot substitute for a case-level explanation.
Expose what a sequence model emphasizes. The review catalogues financial forecasting models using attention over inputs or time periods. This can indicate which parts of the provided sequence receive weight. It offers a way to inspect model behavior, but a highlighted month or news signal is not, by itself, proof that it caused a market movement. The explanation still needs testing against the model's behavior and the user's question.
Build a model whose structure can be inspected. Not every solution requires explaining a black box after training. The appendix includes credit-scoring research that adds nonlinear decision-tree effects to logistic regression. The design aim is to capture more complex relationships while retaining an inspectable model structure. This is a different engineering option from keeping an existing complex model and attaching a separate explainer. These examples appear in the review's application taxonomy.
That distinction changes the development plan. A team choosing a model from scratch can compare an interpretable baseline with a more complex alternative. A team auditing a model it cannot replace needs tools that work on the existing system.
The review's original chart counts attention mechanisms in 10 papers, SHAP in four, and feature-importance analysis in three. It also lists related techniques separately, including TreeSHAP and Shapley values. These labels are not clean, mutually exclusive product categories.
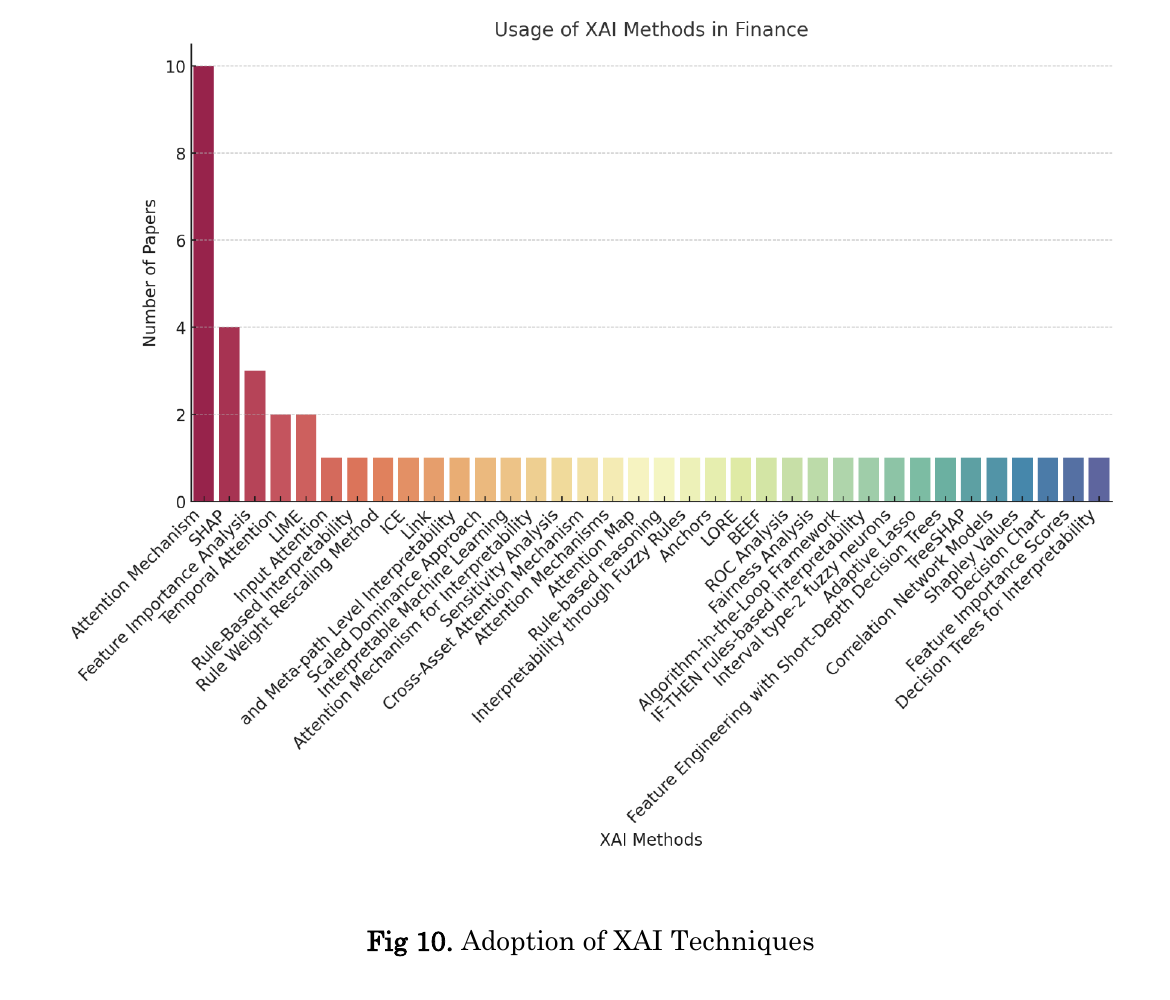
The useful observation is the variety of approaches, especially methods applied after a predictive model has been built. The chart does not establish how many banks deploy them, how well customers understand them, or whether one produces fewer bad decisions.
The review itself identifies the lack of common evaluation standards as a challenge. Its appendix frequently reports predictive measures such as classification accuracy or forecasting error. Those tell us something about predictions; they do not directly tell us whether the accompanying explanation is faithful, understandable or actionable. A useful evaluation needs both sets of questions.
Consider a team adding explanations to an existing credit-risk model. This is a practical application of the review's distinctions, rather than an experiment reported by its authors.
Start with a rejected application and the exact model version and input record used for the decision. A local attribution can show which recorded inputs increased or decreased the model's output relative to a chosen reference population. The reviewer then checks those inputs against the underlying record. An unexpectedly influential value may expose a data problem worth investigating.
Next, compare explanations across similar cases and across reasonable reference populations. If the displayed reason changes substantially while the decision barely changes, the team needs to understand that instability before presenting a single confident sentence to a customer.
Finally, separate “this input contributed to the prediction” from “changing this input will improve your outcome.” The latter needs additional assumptions about what can change, which other variables move with it, and whether the model remains valid after the change. An attribution alone does not provide that answer. Our causal-fairness research coverage explains why observed associations and intervention questions can lead to different conclusions.
This workflow also distinguishes the audiences. A model developer may need a contribution plot. An operations reviewer needs a verifiable reason and a route to correct a bad record. A customer needs language they can understand and a meaningful next step. Reusing the same visualization for all three is a product assumption to test, not a feature of the explanation algorithm.
For an existing tree-based model, SHAP's TreeExplainer is a concrete starting point. It supports common tree ensembles and explains their outputs through feature contributions. Record the background data and feature-dependence setting: these choices affect the question the explanation answers. Also specify whether contributions explain the raw model score or a probability, so the interface does not label log-odds as percentage points.
A minimal starting path is to freeze a model and held-out set, generate local explanations for errors and representative correct cases, and have reviewers trace the prominent inputs back to source records. Check explanation stability, runtime and whether the reasons help reviewers find mistakes. Do this before adding a natural-language layer that can make an uncertain explanation sound more definite.
If model selection is still open, InterpretML's Explainable Boosting Machine offers an alternative: an additive model with inspectable feature effects and selected interactions. Compare it with the existing model using the same data splits and outcome measures. Its role is to provide a transparent modeling candidate, rather than to certify the fairness of another model.
The acceptance test should include a real user task: can reviewers identify an erroneous input, explain the decision accurately, and recognize when the explanation does not justify an action? Measure those outcomes alongside predictive performance and review time. A pleasing chart or higher self-reported confidence is insufficient if reviewers become more confident in incorrect decisions.
The strongest use of this review is to broaden the team's design choices. Explainability can mean inspecting a model's structure, explaining a particular output, or helping a person make a better decision. Those objectives overlap, but they are not interchangeable.
Choose the user task first. Then compare the simplest suitable model and explanation combination against the current workflow. We would favor a more complex approach only when it preserves predictive value and demonstrably improves the review task. The review provides candidates for that comparison; it does not settle it.
Explaining the Unexplainable: A Systematic Review of Explainable AI in Finance, by Md Talha Mohsin and Nabid Bin Nasim. This article uses arXiv version 3, posted 11 November 2025. The original figures are reproduced as source evidence with attribution; the implementation workflow is TechClarity's analysis.
Examine why an observed outcome gap does not, by itself, identify its cause.
Ask whether an explanation improves the user’s next unaided decision.
Separate evidence extracted from corporate disclosures from predictions about future risk.